Why Every Trader Needs to Understand Position Changes
October 23, 2026
By Hyperdash
Over 24 hours this week, nearly half of the net BTC buying on Hyperliquid came from shorts closing, not new longs.
When price makes a big move, the first thing traders need to know is who was behind it and how that impacts market structure moving forward.
Published
October 23, 2026
Author
Hyperdash
Reading time
4 min read
Category
Tools & Data
On most exchanges you can only guess from the tape. On Hyperliquid every position is on-chain, so you can see exactly which wallets were buying and selling, and how their positions changed along the way.
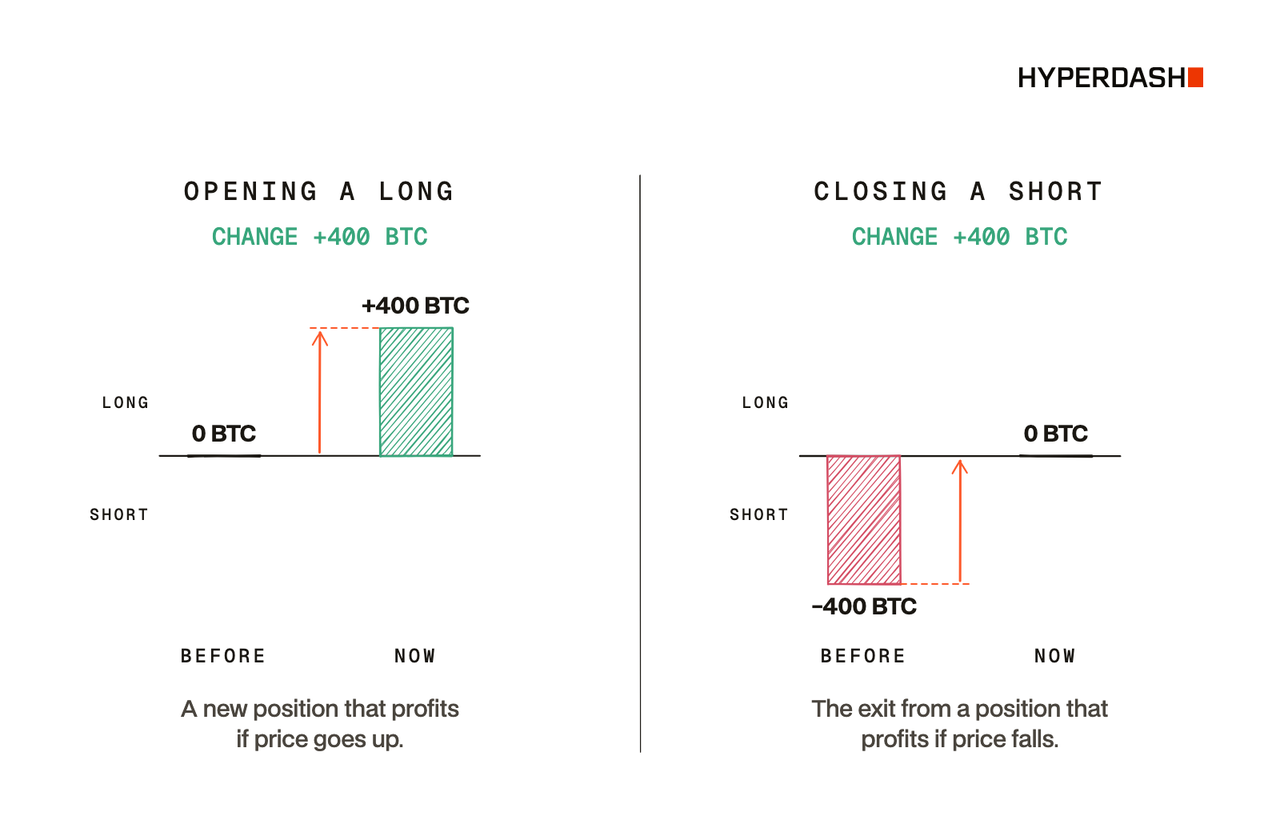
The catch is that a buy is not always a new position. A wallet buying 400 BTC could be opening a new long, or it could just be closing a short it has held for weeks. Both show up as the same green number, and reading them the same way is one of the easiest mistakes to make when you begin to follow order flow dynamics.
In this article, I'll show you how position changes work and how to read them on Hyperdash.
How Position Changes Work
The Position Changes widget takes a snapshot of every position at the start of your window and compares it to where that position is now. The difference is the change. A green change means the wallet bought, either by opening or adding to a long or by closing part of a short. A red change means the wallet sold, either by opening or adding to a short or by closing part of a long.
That is why it helps to look at where a position started and where it ended up, not just the size of the change.
Setting Up the Widget
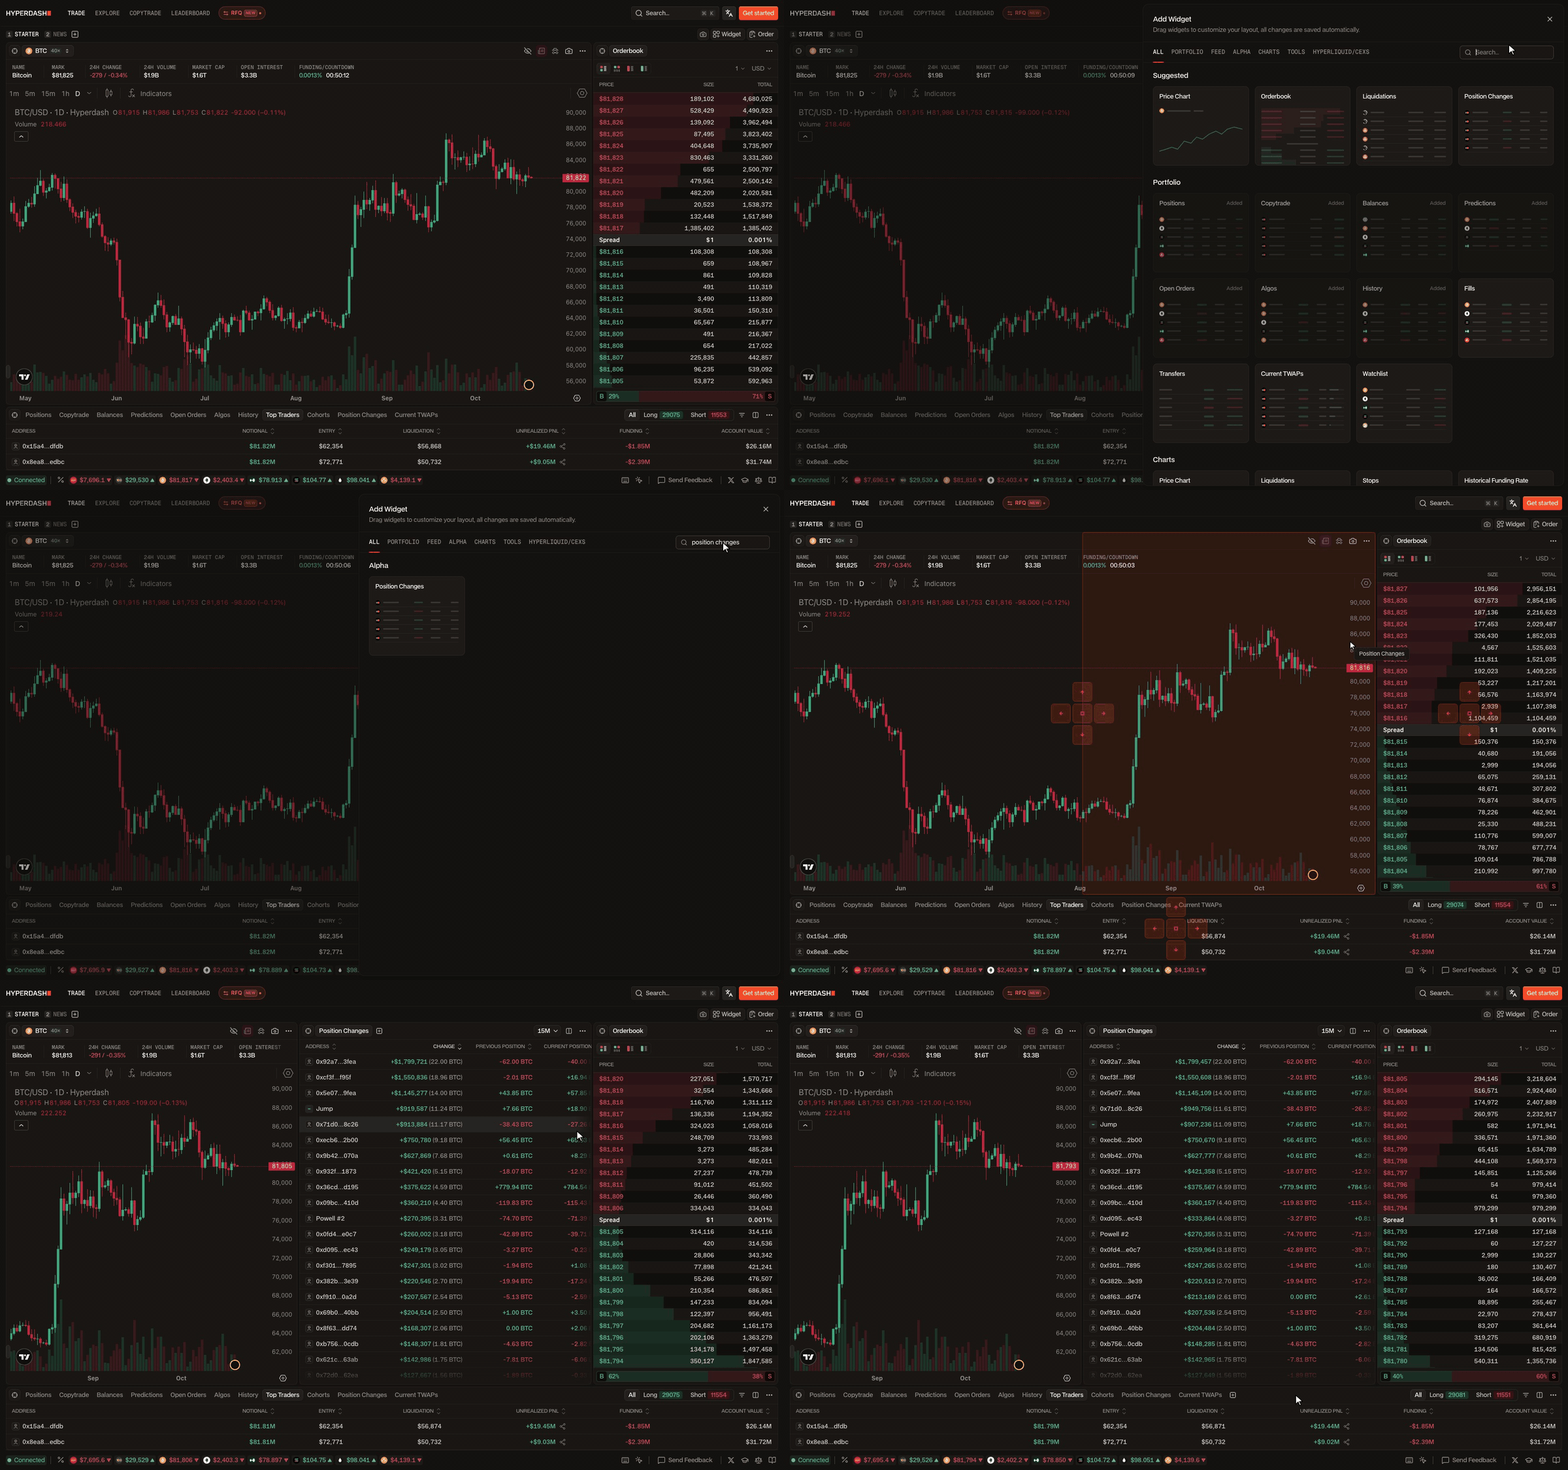
In the widgets panel, search for "Position Changes", then drag and resize it to fit your custom layout. By default the widget follows your active market, but you can also link it to a specific one if you have multiple charts open.
Choose your time window: 15 minutes, 1 hour, 4 hours, 24 hours, 3 days or 7 days. Signed out you will only see the last 15 minutes, so sign in to unlock the longer windows. The column button next to it lets you choose which columns to show.
Reading the Table
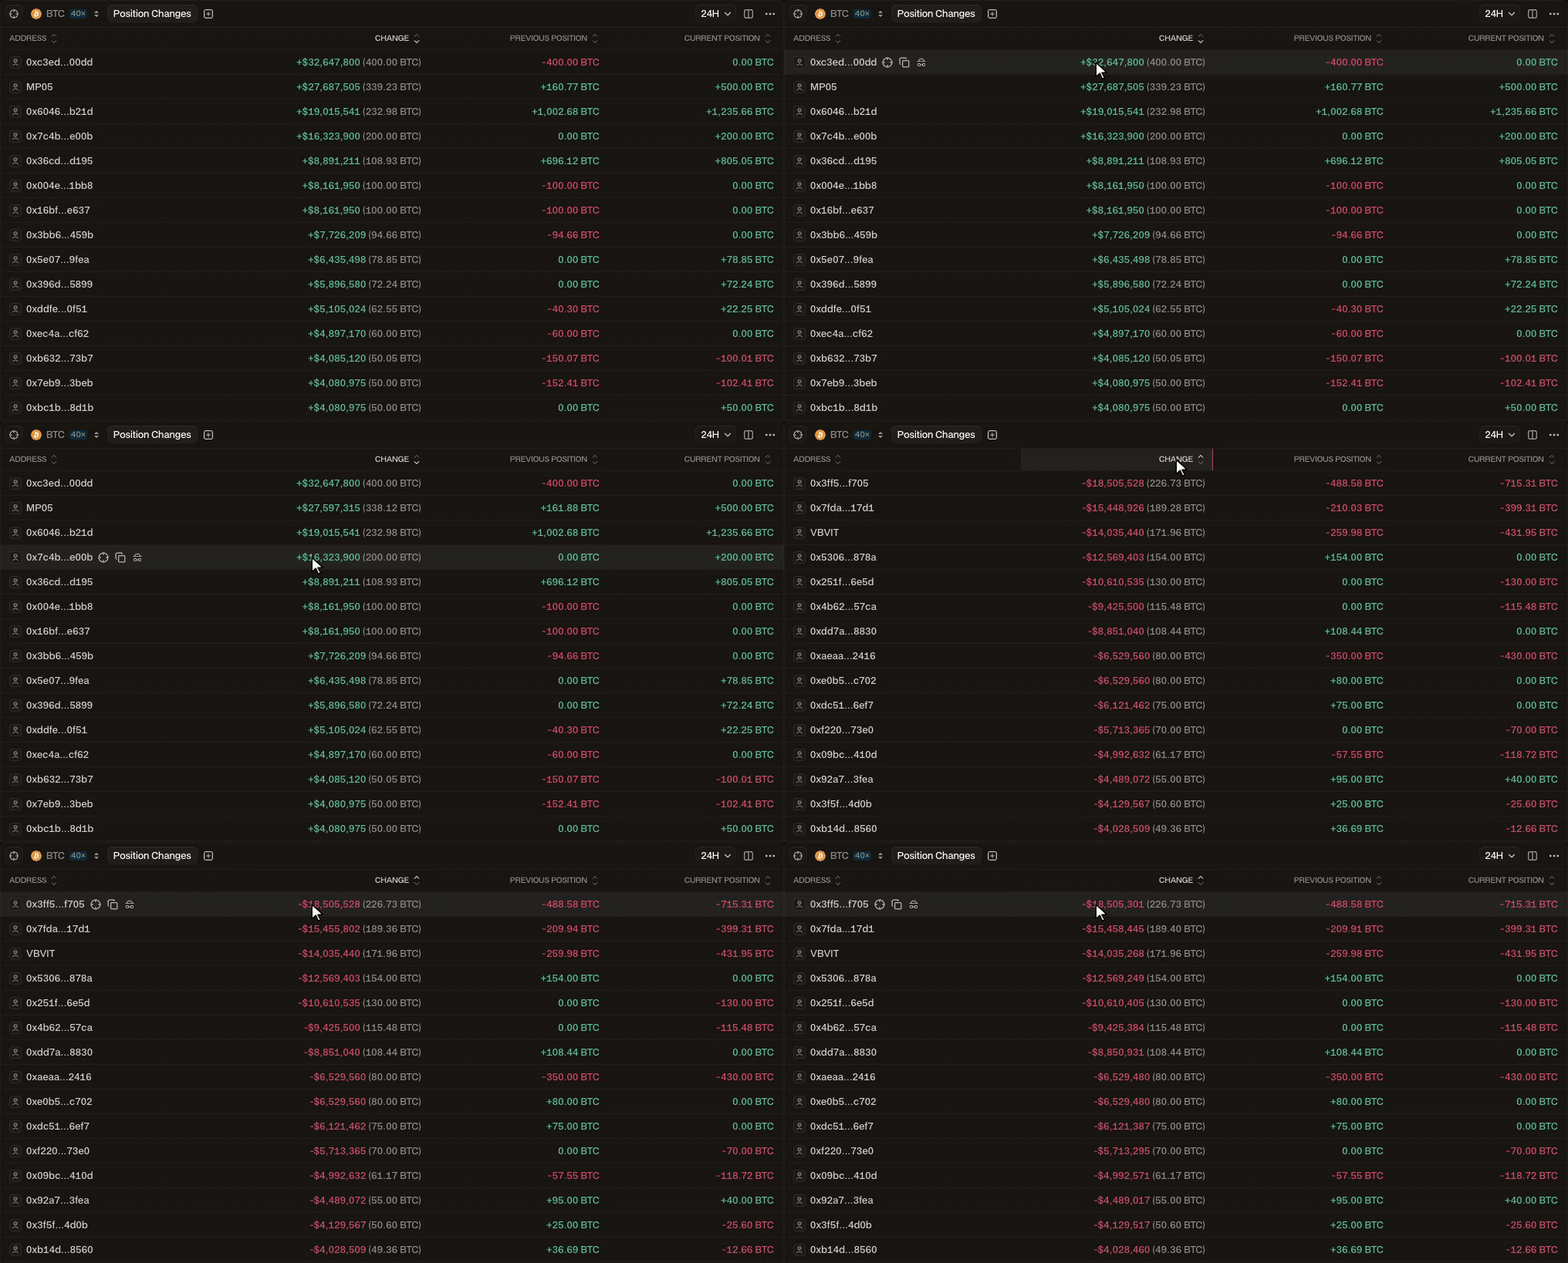
Each row contains information on the trader behind the change, showing their current position, previous position and net delta of the change. By default the table is sorted with the biggest buyers first. Clicking on the Change header flips the sort so you can see the biggest sellers instead.
The previous and current columns are what tell you which kind of trade each change was. All five of the moves below show up as the same green change:
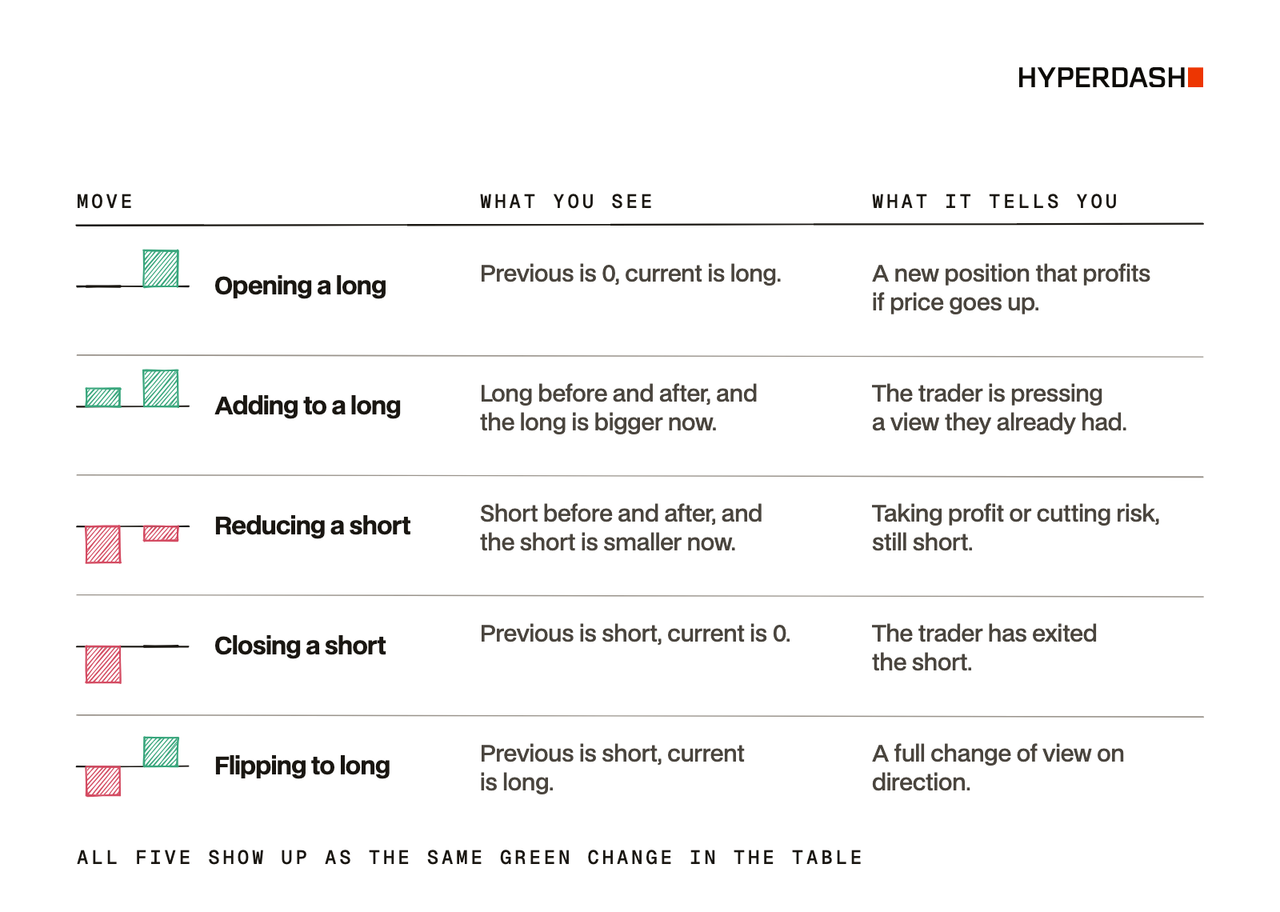
For example, over the 24 hours to 6:58 PM EST on October 19th, the wallet labeled MP05 went from a 400 BTC short to a 500 BTC long, a $73.8M swing and the biggest change on BTC in that window. Without the previous and current columns, that would just look like a big buyer. With them, you can see a trader who flipped from one side to the other.
Choosing Your Window
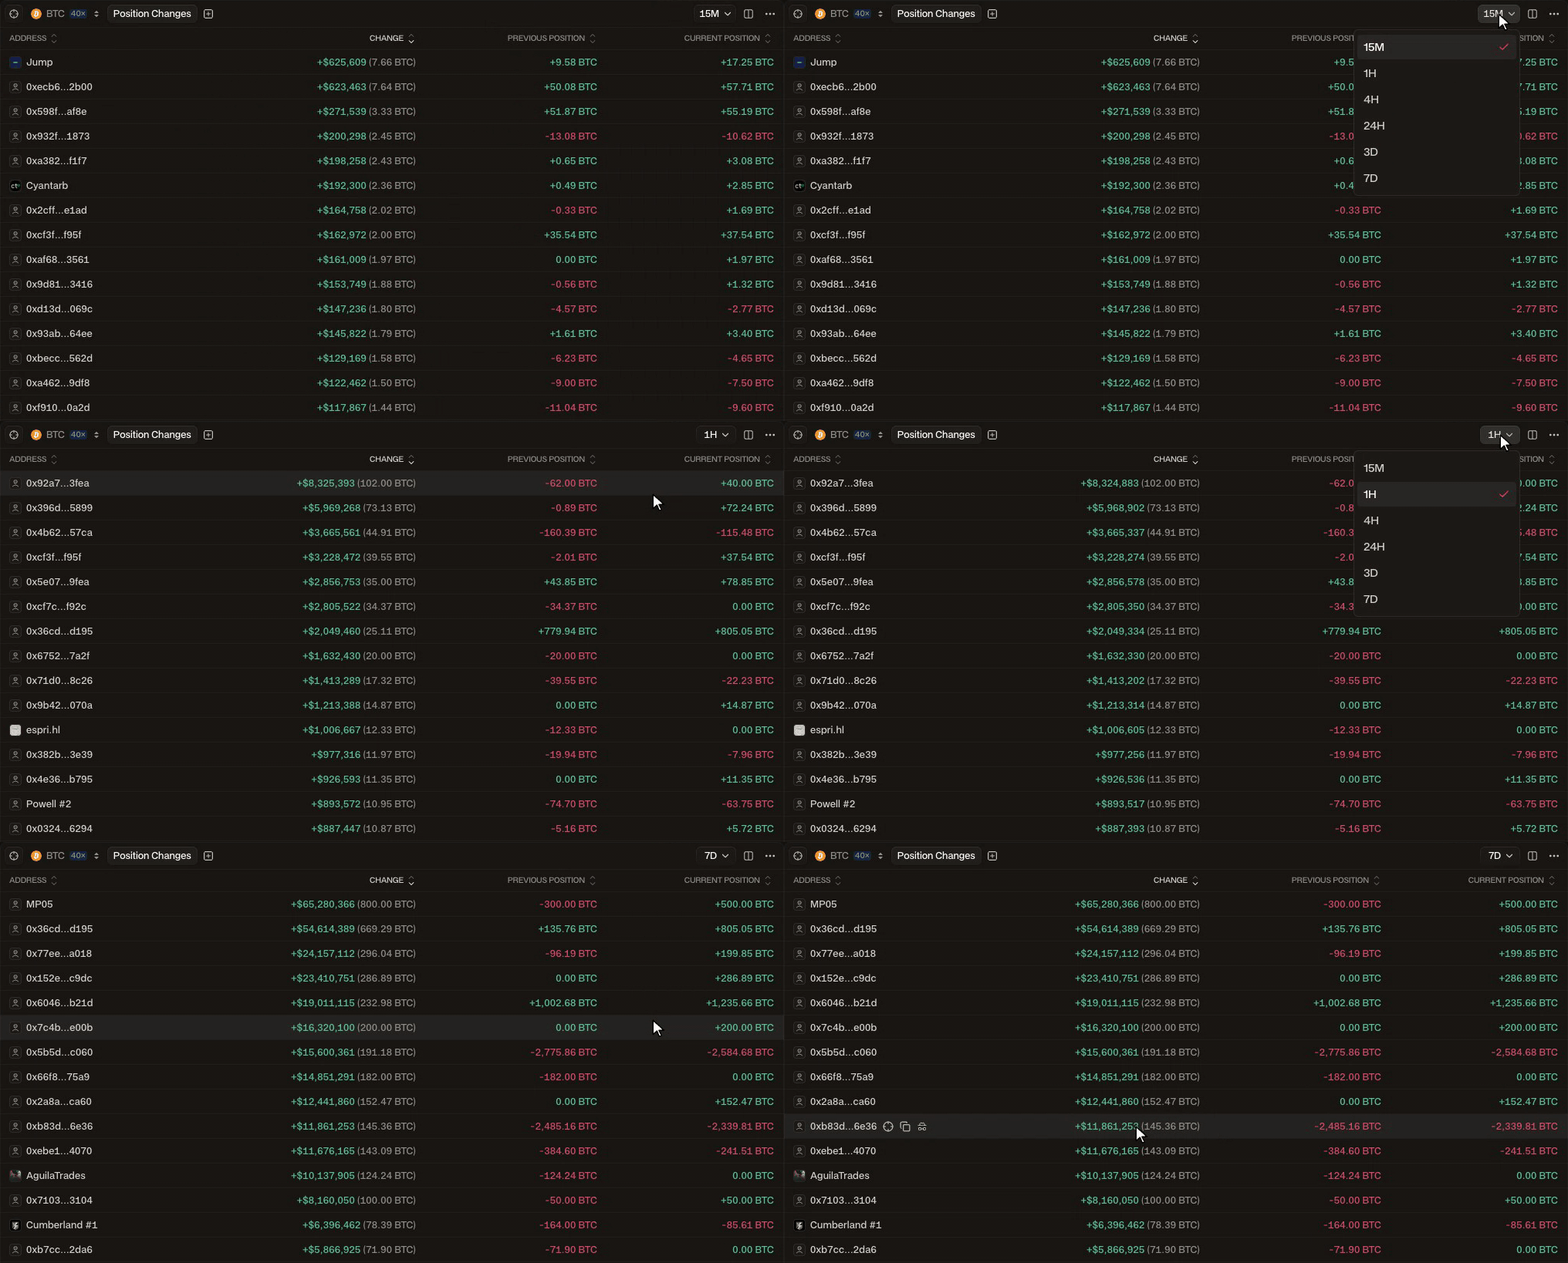
Shorter windows are useful for seeing who is behind a move as it happens. After a sharp move, I open Position Changes to see whether a few large wallets drove it or whether it was spread across a lot of traders. A move driven by one wallet closing out a position can reverse once they are done.
The longer windows show you who has been building a position over days. Before opening a trade, it can help to check the 24 hour and 7 day windows to see who has been adding on each side. Combined with the liquidation heatmap from our first lesson, this gives you a good picture of where positions sit and who is still adding to them.
Building Your Tracked Trader List
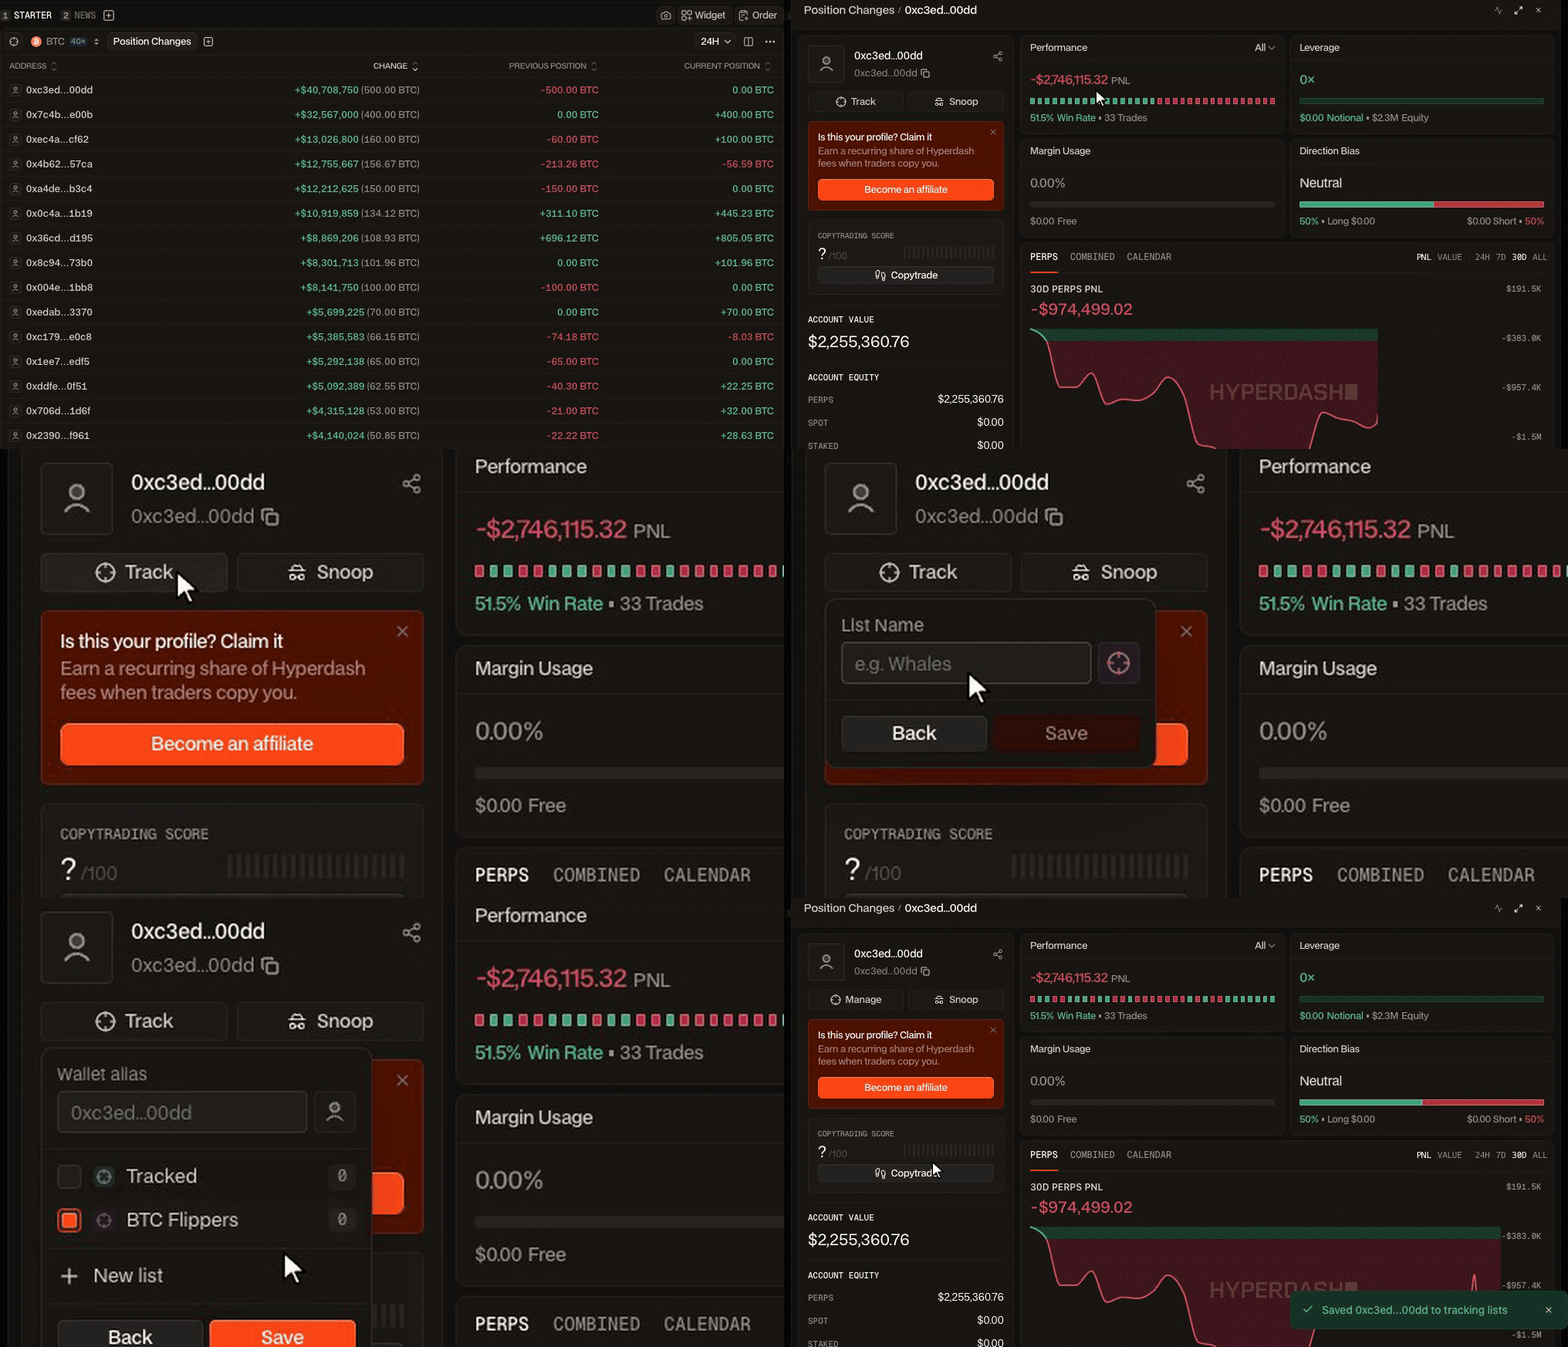
Clicking on any row opens a preview of that trader without leaving the terminal. We show you their PnL, leverage, margin usage, direction bias and every open position and more. From here you can track the wallet, save it to a list or copy trade it.
Understanding Market Structure
When analyzing market moves, it's helpful to use Position Changes to understand the buying and selling dynamic happening across assets. For example, in the 24 hours to 3:54 PM EST on October 20th, traders on Hyperliquid added a net $358.8M of BTC to their positions.
When we split that net buying by where each position started, 48% of it was shorts closing, not new or added longs. Even among the 10 biggest buyers, about half of their net buying was closing a short.
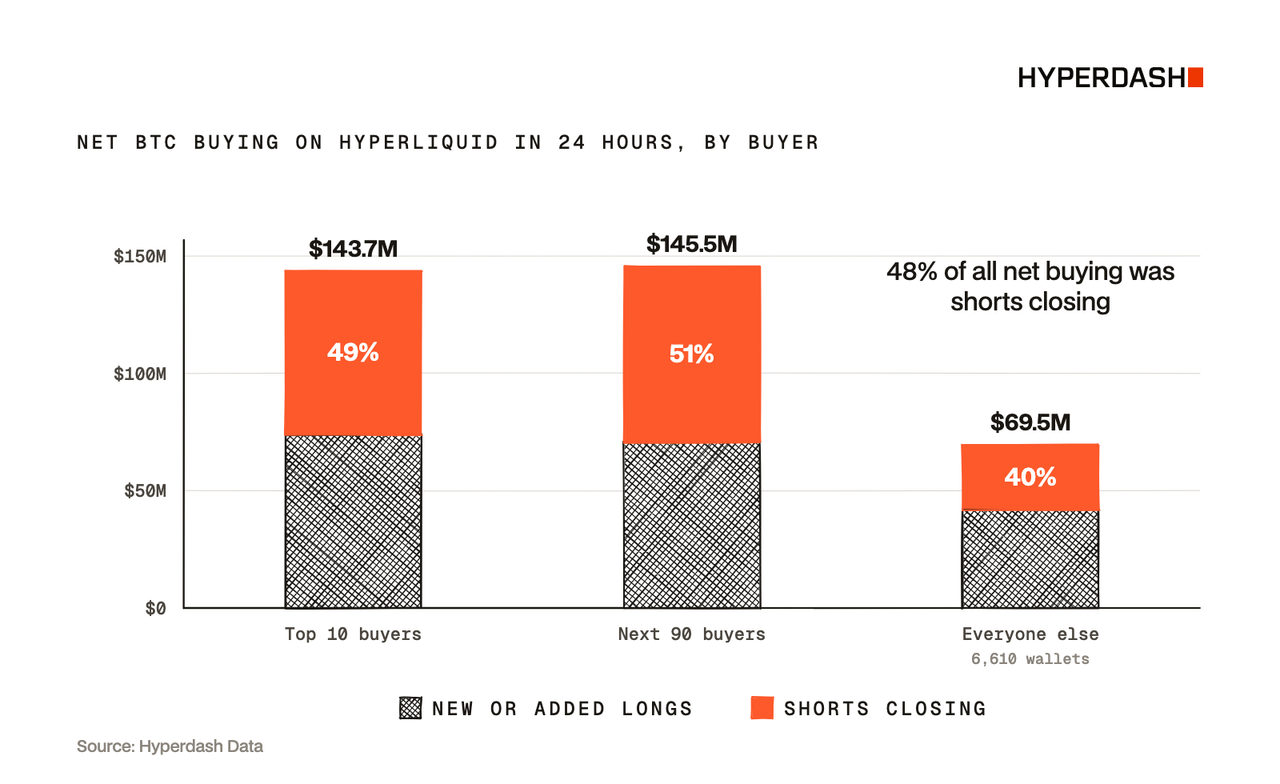
For most traders, the hidden side of a position change is the position it started from. The biggest buyer on the table is not always the most bullish wallet, and Position Changes on Hyperdash shows you both sides of every change so you can tell the difference.
Trade smarter with Hyperdash today.