How to Analyze Trader Performance on Hyperliquid
November 18, 2026
By Hyperdash
Only 28 of the top 155 directional traders on Hyperliquid made money in rising, falling and sideways markets between December 2025 and October 2026.
We pulled the top 200 traders by all-time PnL with at least $100K in their account and removed the market makers and algos, which left 155. More of them made money in the months BTC fell than in the months it rose: 117 against 82.
Published
November 18, 2026
Author
Hyperdash
Reading time
6 min read
Category
Data API
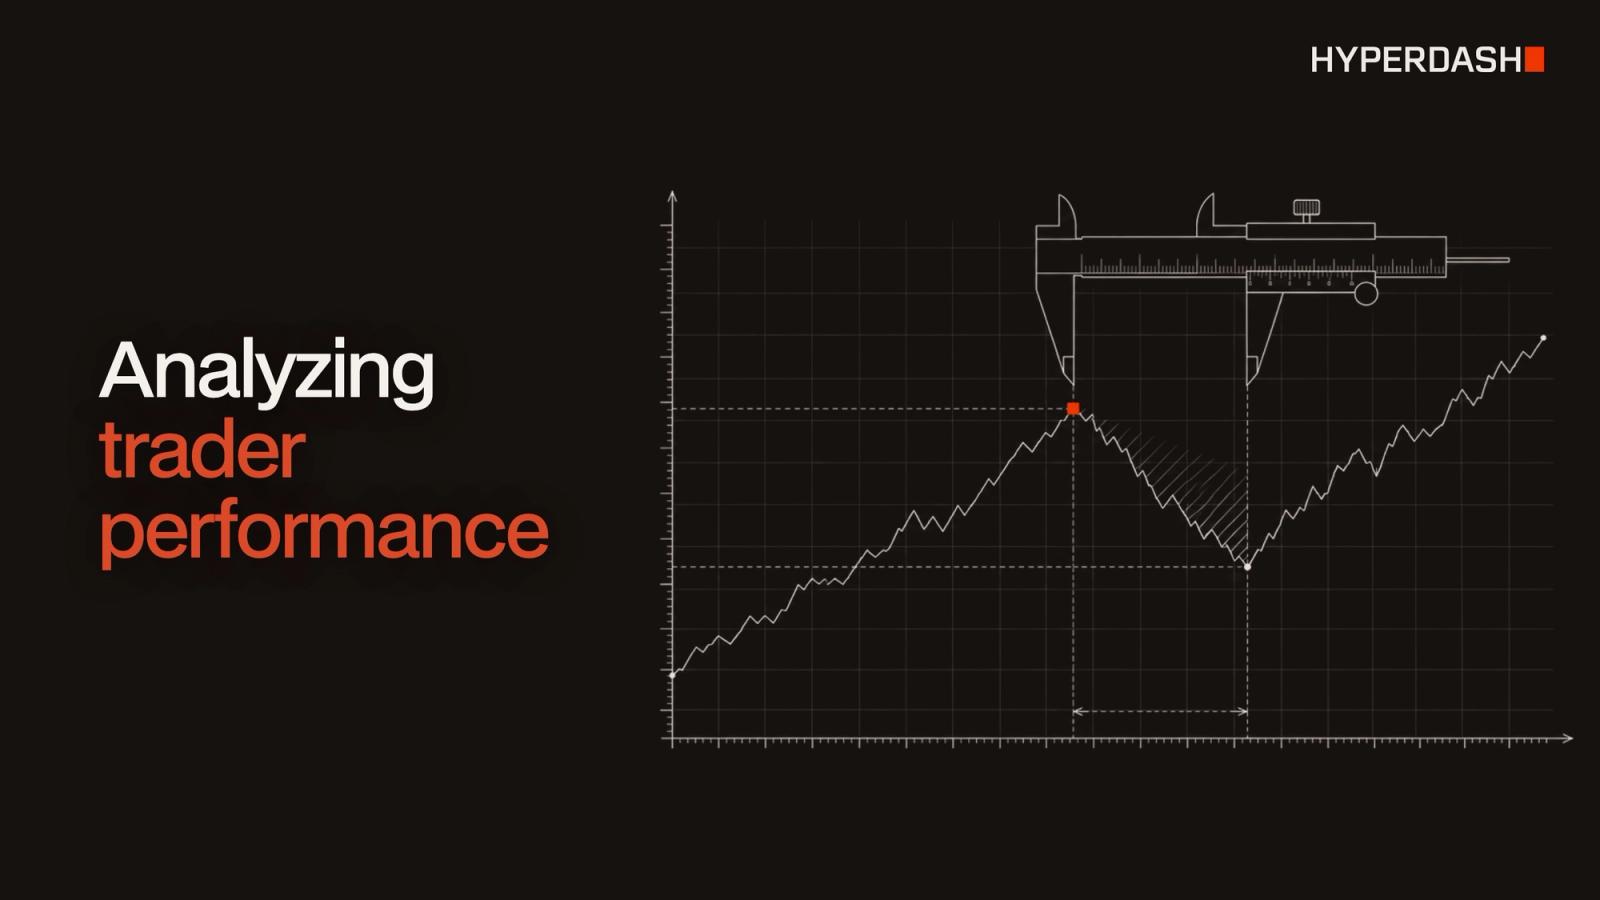
The way to analyze trader performance on Hyperliquid is to run three checks on any wallet: how the trader did in each market environment, how much risk they took to get their PnL, and whether it all came from one good month. This guide shows each check and the Hyperdash Data API requests to run it. Figures are as of November 13, 2026.
What data do you need to analyze a Hyperliquid trader?
Four things: a list of traders, each trader's daily PnL, their risk metrics, and the price history of the market you want to measure against.
| Data | Endpoint | What it returns |
|---|---|---|
| List of traders | /v1/traders/screener | Ranked traders filtered by PnL, account size, win rate, Sharpe, drawdown or trading style |
| Daily PnL | /v1/accounts/{address}/portfolio-daily | Each wallet's account value and PnL for every day, up to 365 days per request |
| Risk metrics | /v1/accounts/{address}/risk-metrics | Sharpe and Sortino over 30 to 365 days, and max drawdown over 7 to 365 days |
| Price history | /v1/markets/{coin}/candles | Daily candles for BTC or any other market |
The trader list, sorted by all-time PnL, with at least $100K in the account:
curl "https://data.hyperdash.com/v1/traders/screener?sort=pnlPerpAllTime&timeframe=alltime&min_account_value=100000&limit=200" -H "Authorization: Bearer $HYPERDASH_API_KEY"
One wallet's risk metrics:
curl "https://data.hyperdash.com/v1/accounts/0xADDRESS/risk-metrics" -H "Authorization: Bearer $HYPERDASH_API_KEY"
The screener tags algorithmic wallets, so market makers and algos can be left out before the analysis. The same trader lists are on the Explore page of hyperdash.com, and any wallet's history is on its address page; How to Get Hyperliquid Wallet PnL and Trade History covers those endpoints in detail.
How did the trader do in each market environment?
Split the period by BTC's return each month. We counted a month where BTC rose more than 5% as up, a month where it fell more than 5% as down, and anything in between as sideways. From December 2025 to October 2026 that gives 4 up months, 4 down months and 3 sideways months.
Daily BTC candles for the year come from one request:
curl "https://data.hyperdash.com/v1/markets/BTC/candles?interval=1d&start_time=1764547200000&end_time=1793491200000" -H "Authorization: Bearer $HYPERDASH_API_KEY"
Grouped by environment, 82 traders were profitable in the up months, 117 in the down months and 89 in the sideways months.
| Market environment | Months | Profitable traders (of 155) |
|---|---|---|
| Up (BTC +5% or more) | 4 | 82 |
| Down (BTC -5% or more) | 4 | 117 |
| Sideways | 3 | 89 |
| All three | 11 | 28 |
The 28 traders who were profitable in all three are the ones to look at first, since their results do not depend on the market moving in one direction.
You can define the environments however you like. Use ETH or HYPE instead of BTC, use weekly returns, or split by volatility instead of direction.
How much risk did the trader take for their PnL?
Compare PnL with the Sharpe ratio and the maximum drawdown. A 365-day Sharpe ratio needs a full year of trading, which 102 of the 155 traders have.
Ranked by PnL and by Sharpe, only 7 of those 102 appear in both top 20s. The top 20 by PnL had a median max drawdown of 44% over the year, against 18% for the top 20 by Sharpe.
| Top 20 by PnL | Top 20 by Sharpe | |
|---|---|---|
| Median max drawdown, 365 days | 44% | 18% |
50 of the 155 traders saw their account fall more than 50% from its peak at some point in the year. A large PnL with a large drawdown usually means large size, and often leverage, more than skill. Position sizing is what separates the two.
For a custom date range, the sharpe endpoint returns Sharpe and Sortino between two dates:
curl "https://data.hyperdash.com/v1/accounts/0xADDRESS/sharpe?from=2025-12-01&to=2026-10-31" -H "Authorization: Bearer $HYPERDASH_API_KEY"
Did the PnL come from one good month?
The last check is how evenly a trader's results are spread. Of the 135 traders who were profitable over the 11 months, 107 made more than half of their profit in a single month. Only 6 were profitable in at least 9 of the 11 months.
The best of those 6 made $9.2M over the 11 months with a Sharpe ratio of 5.73, a max drawdown of 6% and a profit in 10 of the 11 months, across all three market environments.
The daily PnL calendar shows the same thing for one wallet:
curl "https://data.hyperdash.com/v1/accounts/0xADDRESS/pnl-calendar?from=2025-12-01&to=2026-10-31" -H "Authorization: Bearer $HYPERDASH_API_KEY"
How do you run this analysis with an AI agent?
The easiest way is to give the prompt below to an AI agent such as Claude Code or Codex with your API key set, or to any chat connected to the Hyperdash MCP server (setup guide):
"Pull the top 200 Hyperliquid traders by all-time PnL with at least $100K in their account and leave out market makers and algos. For each, get a year of daily PnL and their Sharpe ratio and max drawdown over 365 days. Split the year into up, down and sideways months by BTC's monthly return, with more than 5% up or down as the cutoff. Show which traders made money in all three, ranked by Sharpe, with the share of their profit that came from their best month."
Add "Build it as an interactive dashboard in a local HTML file and open it in my browser," and the agent puts the results in a dashboard you can rerun. From there you can swap BTC for another market, change the 5% thresholds or run it on your own list of traders.
How should you use the three checks?
Run any trader you are researching through all three before anything else: how they did in each market environment, their drawdown over the full year, and how much of their PnL came from their best month. Of the 155 traders here, only 28 passed the first check, and 107 of the 135 profitable ones failed the last.
FAQ
What is a good Sharpe ratio for a crypto trader?
Sharpe is return per unit of volatility, annualized. Above 1 is solid and above 2 is strong over a full year. The ratio means little over a short window or a few active days, which is why the 365-day figure needs a full year of history.
What is max drawdown?
The largest fall in account value from a peak before a new peak, as a share of the peak. A 50% drawdown means the account lost half its value at some point.
Why look at market environments instead of total PnL?
Total PnL can come from one direction. A trader who was long through a rising market can show a large PnL without any edge in falling or flat markets.
Is win rate a good measure of a trader?
On its own, no. A high win rate with small wins and occasional large losses can still lose money. Read it next to PnL, drawdown and the size of average wins and losses.
Where can I see top Hyperliquid traders?
The Explore page on hyperdash.com ranks traders by PnL, win rate, Sharpe and more. The /v1/traders/screener endpoint returns the same lists in code.
Does this analysis work for any wallet?
Yes. Every Hyperliquid wallet is public, so the three checks run on any address, including your own.
Get started
Get a Hyperdash Data API key, then follow the Quickstart or the recipes in the docs. The launch post, Hyperdash Data API Is Live, covers plans and datasets.