Hyperliquid Funding Rates: Live Scanner and Full History
November 18, 2026
By Hyperdash
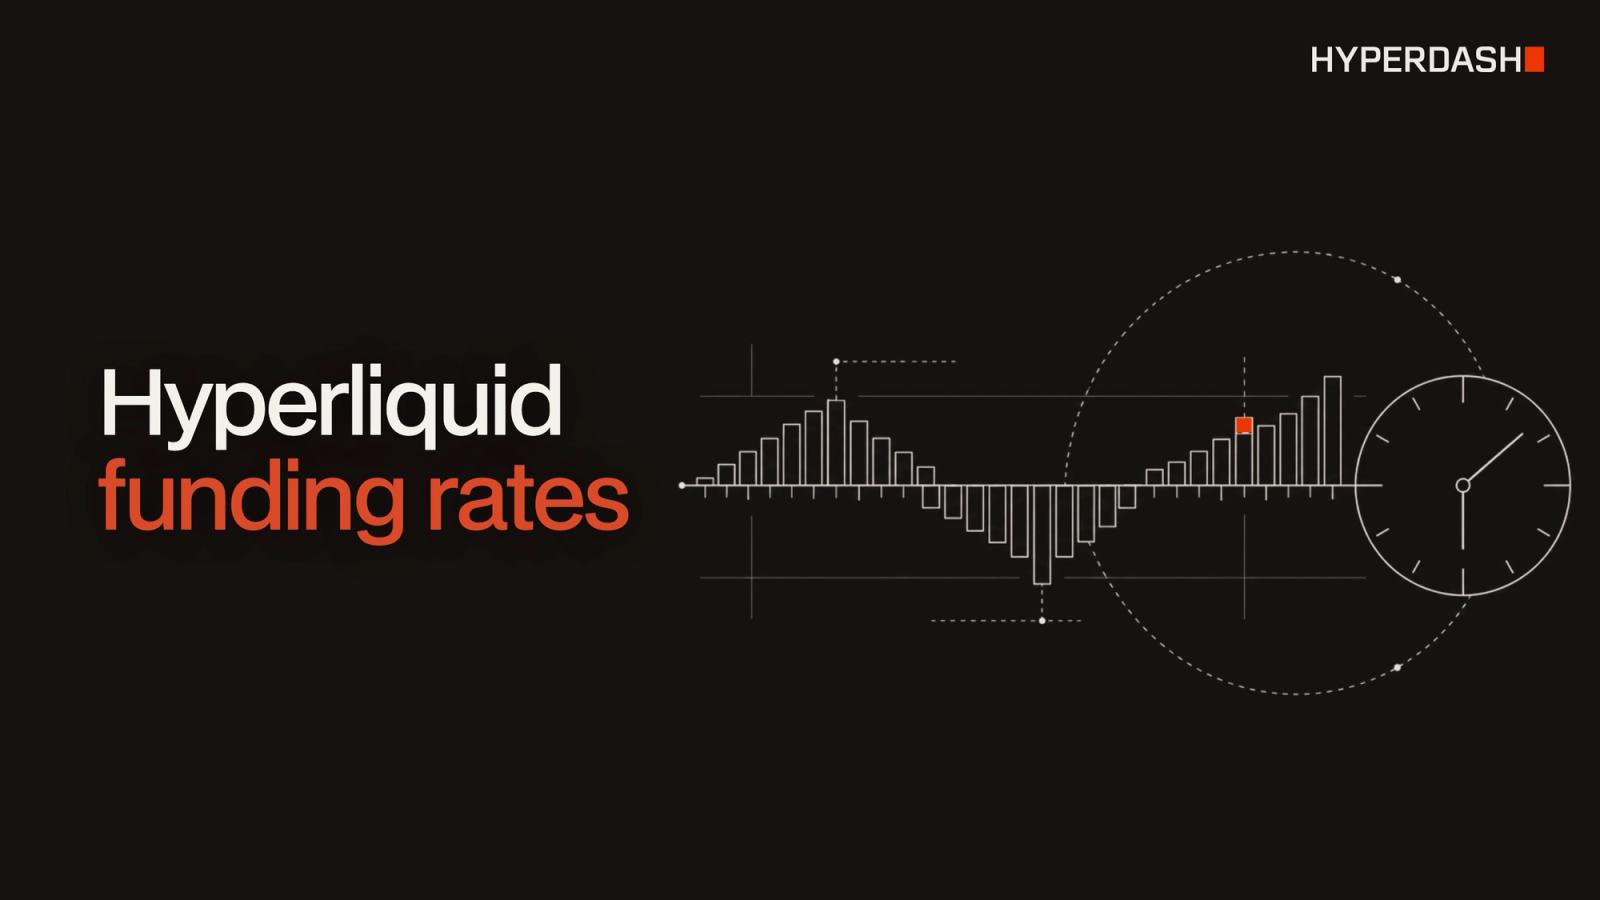
Hyperliquid funding rates are paid every hour between longs and shorts on every perpetual market. A positive rate means longs pay shorts; a negative rate means shorts pay longs. You can see the live rate of any market on its Hyperdash asset page, scan every market at once with the Hyperdash Data API funding screener, and pull settled funding history back to May 20, 2023.
This guide covers how the rate is calculated, where to see it live, how to build a funding rate scanner, and how far back each source goes.
Published
November 18, 2026
Author
Hyperdash
Reading time
6 min read
Category
Data API
How do Hyperliquid funding rates work?
Funding keeps a perpetual contract's price close to the price of the underlying asset. On Hyperliquid it is paid every hour, peer to peer, and the exchange takes no fee from it. The payment for one hour is position size times oracle price times the funding rate.
The rate has two parts, according to the official funding documentation:
- Interest rate: fixed at 0.01% per 8 hours, which is 0.00125% per hour or about 11.6% a year, paid to shorts.
- Premium: the gap between the contract's price and the oracle price, sampled every 5 seconds and averaged over the hour. When the contract trades above the oracle, the premium is positive and longs pay.
The formula is set on an 8-hour basis and paid hourly at one eighth of that rate. Funding is capped at 0.5% per hour, a much wider cap than most centralized exchanges use. HIP-3 markets use a more responsive premium formula, and their deployers can set a funding multiplier and interest rate (see What Is HIP-3 on Hyperliquid?).
For what funding means for a position and how traders use it, see Funding Rates Explained.
Where can you see live Hyperliquid funding rates?
There are three places, depending on whether you want one market or all of them.
- Hyperdash asset pages. Every market's page, such as hyperdash.com/asset/BTC, shows the current funding rate next to price, volume and open interest. The Historical Funding Rate widget charts the rate over time for one market (widget list).
- The public Hyperliquid API. The
metaAndAssetCtxsrequest returns the current funding rate of every perp market, andpredictedFundingsreturns predicted rates across venues for the main perp dex. Both are free and documented on the perpetuals info page. - The Hyperdash Data API funding screener. One request returns every market ranked by funding rate, with its APR, mark price, open interest and 24-hour volume.
How do you build a Hyperliquid funding rate scanner?
A funding rate scanner ranks every market by how much one side is paying the other. The Hyperdash Data API recipes include one; it takes three requests.
1. Rank every market right now. The funding screener sorts by highest, lowest or absolute rate and can leave out markets under $1 million or $10 million of open interest, so thin markets do not crowd the list:
curl "https://data.hyperdash.com/v1/markets/funding/latest?sort=abs&min_open_interest_usd=10000000&limit=20" -H "Authorization: Bearer $HYPERDASH_API_KEY"
2. Check whether the rate is persistent. A rate that has been high for a week means more than one hour's spike. The funding matrix returns settled rates for the top markets by open interest, hourly for up to 7 days or daily for up to 90:
curl "https://data.hyperdash.com/v1/markets/funding/matrix?top=20&interval=1d&days=30" -H "Authorization: Bearer $HYPERDASH_API_KEY"
3. Pull the full history of one market. The settled funding rate history returns hourly rates, or rates summed per UTC day, for any range your plan covers:
curl "https://data.hyperdash.com/v1/markets/BTC/funding-rates?interval=1d&start_time=1790812800000&end_time=1793491200000" -H "Authorization: Bearer $HYPERDASH_API_KEY"
Times are in epoch milliseconds, and each response carries a next_cursor for the next page.
| Market | Funding per hour | Annualized | Open interest |
|---|---|---|---|
| xyz:PURRDAT | 0.0174% | 152.7% | $14.8M |
| xyz:UNITREE | -0.0123% | -107.7% | $27.0M |
| xyz:ZHIPU | 0.0115% | 100.9% | $16.1M |
| xyz:SKHX | 0.0088% | 76.9% | $281.1M |
| xyz:SNDK | 0.0048% | 41.8% | $92.3M |
| xyz:MU | 0.0047% | 41.0% | $142.8M |
| xyz:SOXL | 0.0034% | 29.8% | $28.8M |
| FARTCOIN | 0.0022% | 19.1% | $10.3M |
In this snapshot, seven of the eight highest rates were on HIP-3 equity markets, where funding often runs well above the major crypto pairs. A negative rate, as on UNITREE, means shorts were paying longs.
How much funding rate history can you get?
It depends on the source. The public API returns one market's history 500 rows at a time; the Hyperdash Data API returns settled rates by time range, in hourly or daily buckets, from May 20, 2023.
| Source | Live rate | History | Notes |
|---|---|---|---|
| Hyperdash asset page and widget | Yes | Chart per market | Free, in the app |
| Public API `metaAndAssetCtxs` | Every market | No | Free |
| Public API `fundingHistory` | No | Per market | 500 rows per request; page by the last timestamp |
| Hyperdash funding screener | Every market, ranked | No | Filter by open interest |
| Hyperdash funding matrix | No | Top markets, 7 days hourly or 90 days daily | One request for many markets |
| Hyperdash `funding-rates` | No | Hourly or daily, from May 20, 2023 | Depth set by plan |
How far back a Hyperdash plan can query is its history depth: 90 days on Hobby and Starter, 180 on Growth, 365 on Scale and full history on Enterprise (plans). For every other Hyperliquid dataset and its start date, see Hyperliquid Historical Data.
Can you see who pays and earns the most funding?
Yes. Funding is paid between wallets, so it can be traced to the wallets on each side. The Hyperdash Data API returns funding paid and received by side across markets (GET /v1/markets/funding/flows) and the top funding payers and earners in one market (GET /v1/markets/{coin}/funding/top-wallets). For one wallet, GET /v1/accounts/{address}/funding lists every funding payment it made or received, back to February 26, 2023.
Traders who collect funding while staying market neutral usually pair a perp with an offsetting position; Basis Trading and Funding Rate Arbitrage covers how that works.
Ask it in Claude or ChatGPT
The same data is available in plain language through the Hyperdash MCP server. Once it is connected (setup guide), you can ask:
Which Hyperliquid markets with more than $10M of open interest have the highest funding right now, and what was BTC's average daily funding over the last 30 days?
The assistant calls the funding screener and the funding rate history and answers with the numbers.
FAQ
How often is funding paid on Hyperliquid?
Every hour. The rate is calculated on an 8-hour basis and one eighth of it is paid each hour.
What is the maximum funding rate on Hyperliquid?
0.5% per hour. The cap and the funding interval are the same for every asset.
Who pays funding on Hyperliquid?
When the rate is positive, longs pay shorts. When it is negative, shorts pay longs. Funding is peer to peer and Hyperliquid takes no fee from it.
How is the funding APR calculated?
Multiply the hourly rate by 8,760, the number of hours in a year. A rate of 0.01% per hour is about 87.6% a year.
Is there a Hyperliquid funding rate API?
Yes. The public API returns current rates with metaAndAssetCtxs and per-market history with fundingHistory. The Hyperdash Data API adds a ranked screener across every market, a multi-market matrix and settled history by hour or day.
How far back does Hyperliquid funding rate history go?
The Hyperdash Data API has settled funding rates from May 20, 2023. The public API returns history per market in pages of 500 rows.
How is Hyperliquid funding different from overnight swap fees?
Funding is paid between traders and can flow to either side. A CFD swap fee is charged by the broker. Overnight Swap Fees vs Funding Rates compares the two.
Get started
Check any market's live funding on its Hyperdash asset page. To scan every market or pull history by API, get a Hyperdash Data API key and read the Quickstart.