What Is a Liquidation Heatmap? A Trader's Guide to Reading Market Pressure
May 11, 2026
By Hyperdash
If you trade crypto futures without looking at liquidation levels, you are trading blind.
The crypto derivatives market is driven by leverage. When traders take on too much margin and the market moves against them, their positions are forcibly closed by the exchange. These forced closures liquidations create massive, predictable cascades of buying or selling pressure.
Published
May 11, 2026
Author
Hyperdash
Reading time
4 min read
Category
Tools & Data
A liquidation heatmap is the tool professional traders use to see these cascades before they happen.
In this guide, we will explain exactly what a liquidation heatmap is, how to read it, and how to use it to spot reversals and avoid getting caught in a stop hunt.
1. The Mechanics of a Liquidation
To understand the heatmap, you first need to understand how a liquidation works.
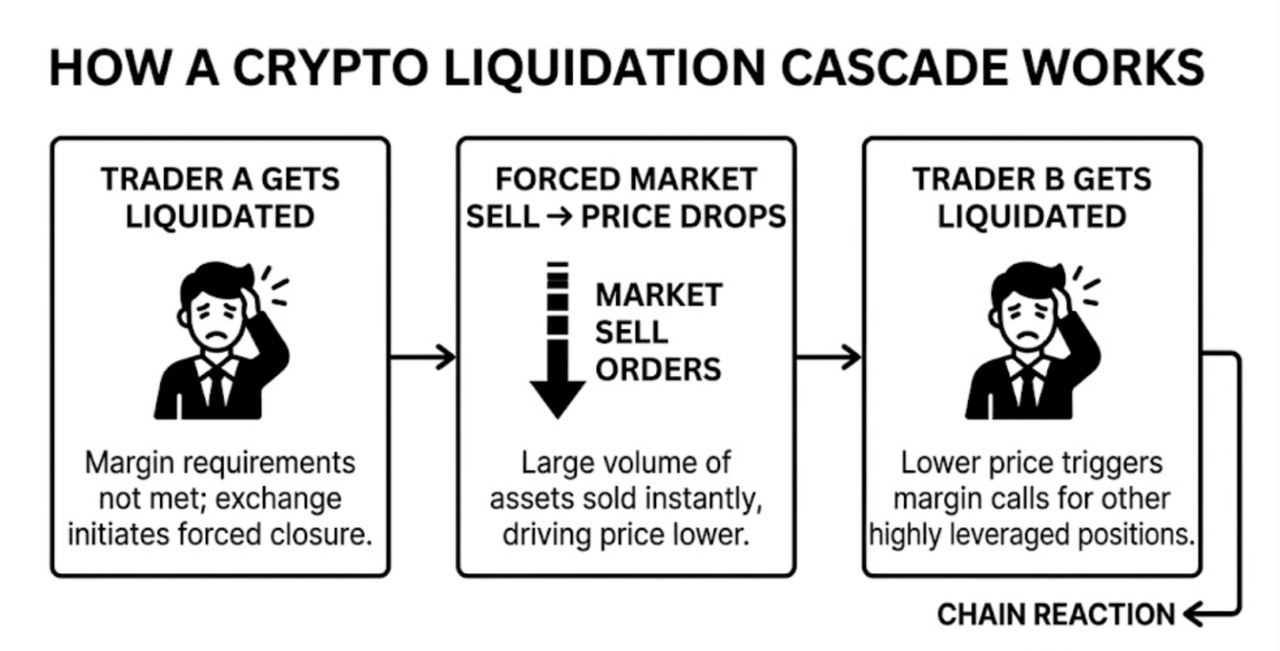
When a trader opens a 50x leveraged Long position on Bitcoin, they only need a 2% price drop to lose their entire collateral. When that 2% drop hits, the exchange's risk engine automatically steps in, takes the trader's collateral, and forcibly sells their Bitcoin into the open market to close the position.
That forced market sell order pushes the price down even further. If there are other over-leveraged Longs just below that price, they get liquidated too, triggering more market sell orders.
This chain reaction is called a liquidation cascade. It is the reason crypto markets frequently experience violent, sudden wicks that wipe out retail traders before immediately reversing.
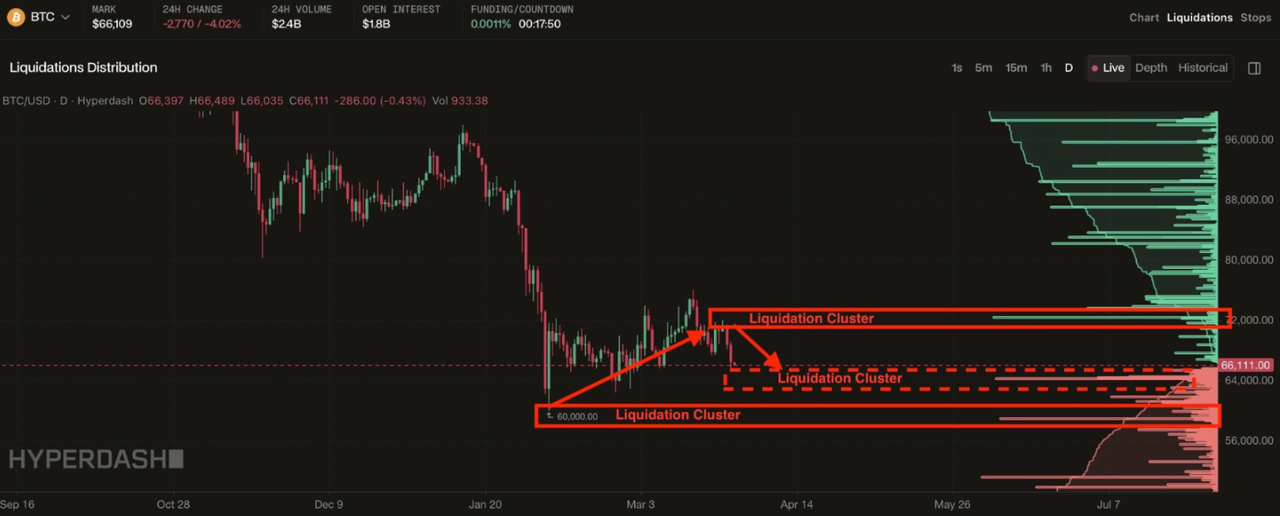
2. What Is a Liquidation Heatmap?
A liquidation heatmap is a visual representation of where all the highly leveraged positions in the market will be forced to close.
Instead of just showing you the current price, the heatmap aggregates the open interest across the market and calculates the exact price levels where mass liquidations will occur.
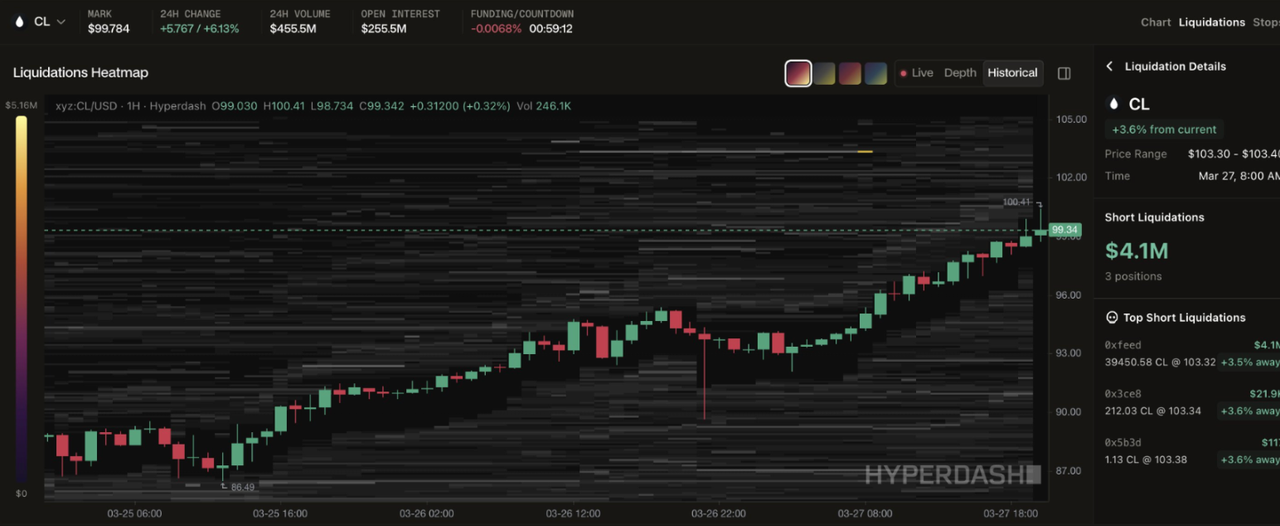
Visually, it looks like a glowing chart:
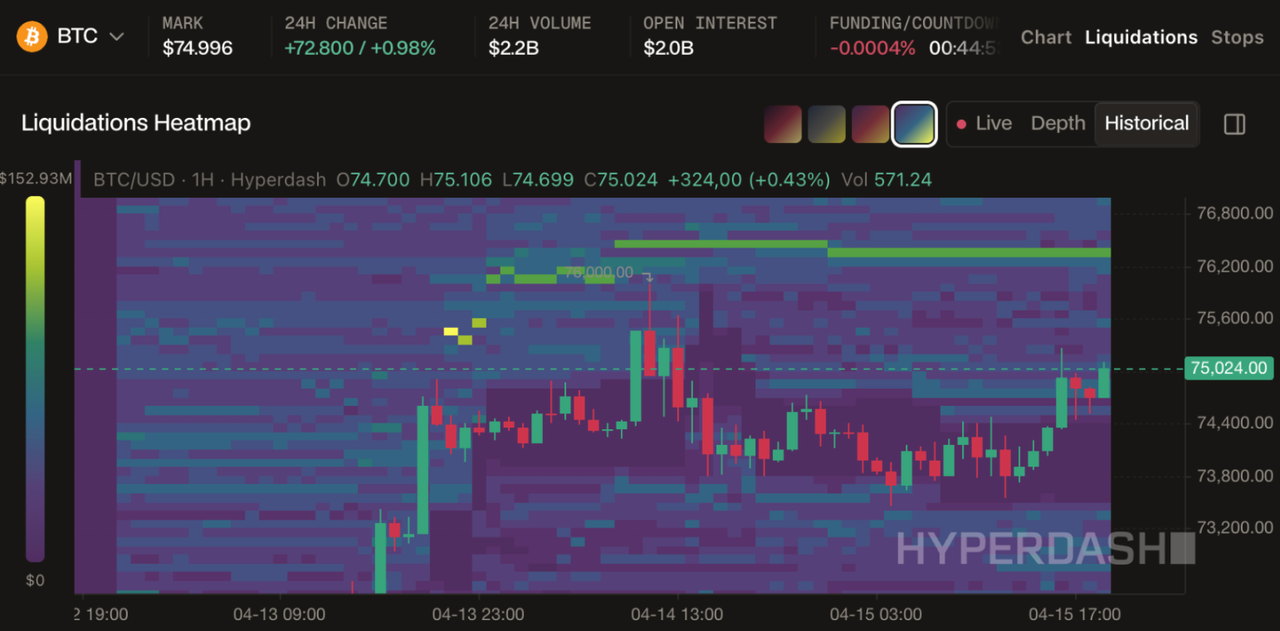
Going to yellow zones indicates massive clusters of leverage. If the price reaches this level, a huge amount of liquidations will be triggered.
Going to purple zones indicates low leverage. The price can move through these areas without triggering significant forced volume.
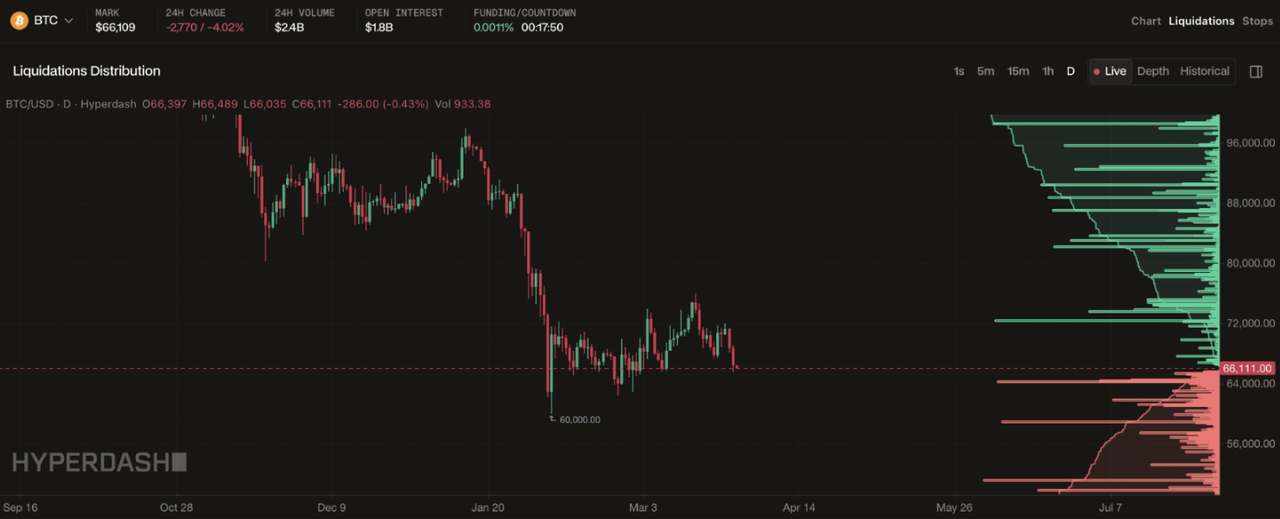
By looking at the Liquidations Distribution, you can instantly see where the market's "pain points" are located:
3. How Smart Money Uses the Heatmap
Institutional traders and market makers do not fear liquidations, they hunt them.
Market makers need liquidity (willing buyers and sellers) to fill their massive orders. If a whale wants to sell $50 million worth of Bitcoin, they cannot simply dump it on the open market without crashing the price and ruining their own execution.
Instead, they look at the liquidation heatmap.
If they see a massive cluster of Long liquidations sitting at $62,000, they know that if they can push the price down to $62,000, the exchange will forcibly sell thousands of Bitcoin. The whale can then use that forced selling pressure as liquidity to fill their own massive buy orders at a discount.
This is why the price of Bitcoin seems to "magnetically" attract to areas of high leverage before suddenly reversing. The market makers are driving the price into the liquidation clusters to fill their own bags.
4. Three Ways to Trade with the Heatmap
Once you know how to read market pressure, you can use the heatmap to improve your own execution:
1. Avoid the Chop
Never place your stop-loss order directly inside a liquidation cluster. Market makers are actively hunting those zones. If your stop is in the cluster, you will be swept up in the cascade. Place your stops safely outside the high-density areas.
2. Trade the Reversal (The "Wick" Play)
When the price violently spikes into a massive liquidation cluster, it often reverses immediately after the liquidations are processed and the market makers have filled their orders. Aggressive traders use the heatmap to place limit orders just past the densest part of the cluster, aiming to catch the exact bottom of the wick.
3. Follow the Magnet
If the market is ranging quietly but there is a massive, glowing cluster of Short liquidations sitting 3% above the current price, the path of least resistance is up. The market will naturally gravitate toward that liquidity. You can use this bias to hold your Long positions longer, knowing the market wants to hit that target.
Conclusion: See the Full Board
Trading without a liquidation heatmap is like playing poker while showing your opponents your cards. The market makers know exactly where your leverage is. It is time you saw their targets, too.
Stop guessing where the reversals will happen. Upgrade your execution and get real-time access to market pressure data with the Hyperdash terminal.
Frequently Asked Questions (FAQ)
Are liquidation heatmaps 100% accurate?
Heatmaps are highly accurate estimates based on exchange open interest and order book data. However, traders can add margin to their positions to move their liquidation price, meaning the clusters can shift dynamically.
What is the difference between an order book and a liquidation heatmap?
An order book shows voluntary limit orders placed by traders. A liquidation heatmap shows i$nvoluntary market orders that will be triggered by the exchange's risk engine.
Do heatmaps work for altcoins?
Yes, but they are most reliable on high-volume, high-open-interest assets like Bitcoin and Ethereum. Low-cap altcoins can be manipulated too easily, making the heatmap less predictive.
Disclaimer: The information provided in this article is for educational purposes only and does not constitute financial, investment, or trading advice. Trading leveraged derivatives carries a high level of risk and may not be suitable for all investors. You could lose some or all of your initial investment. Always conduct your own research and consult with a certified financial advisor before making any trading decisions.